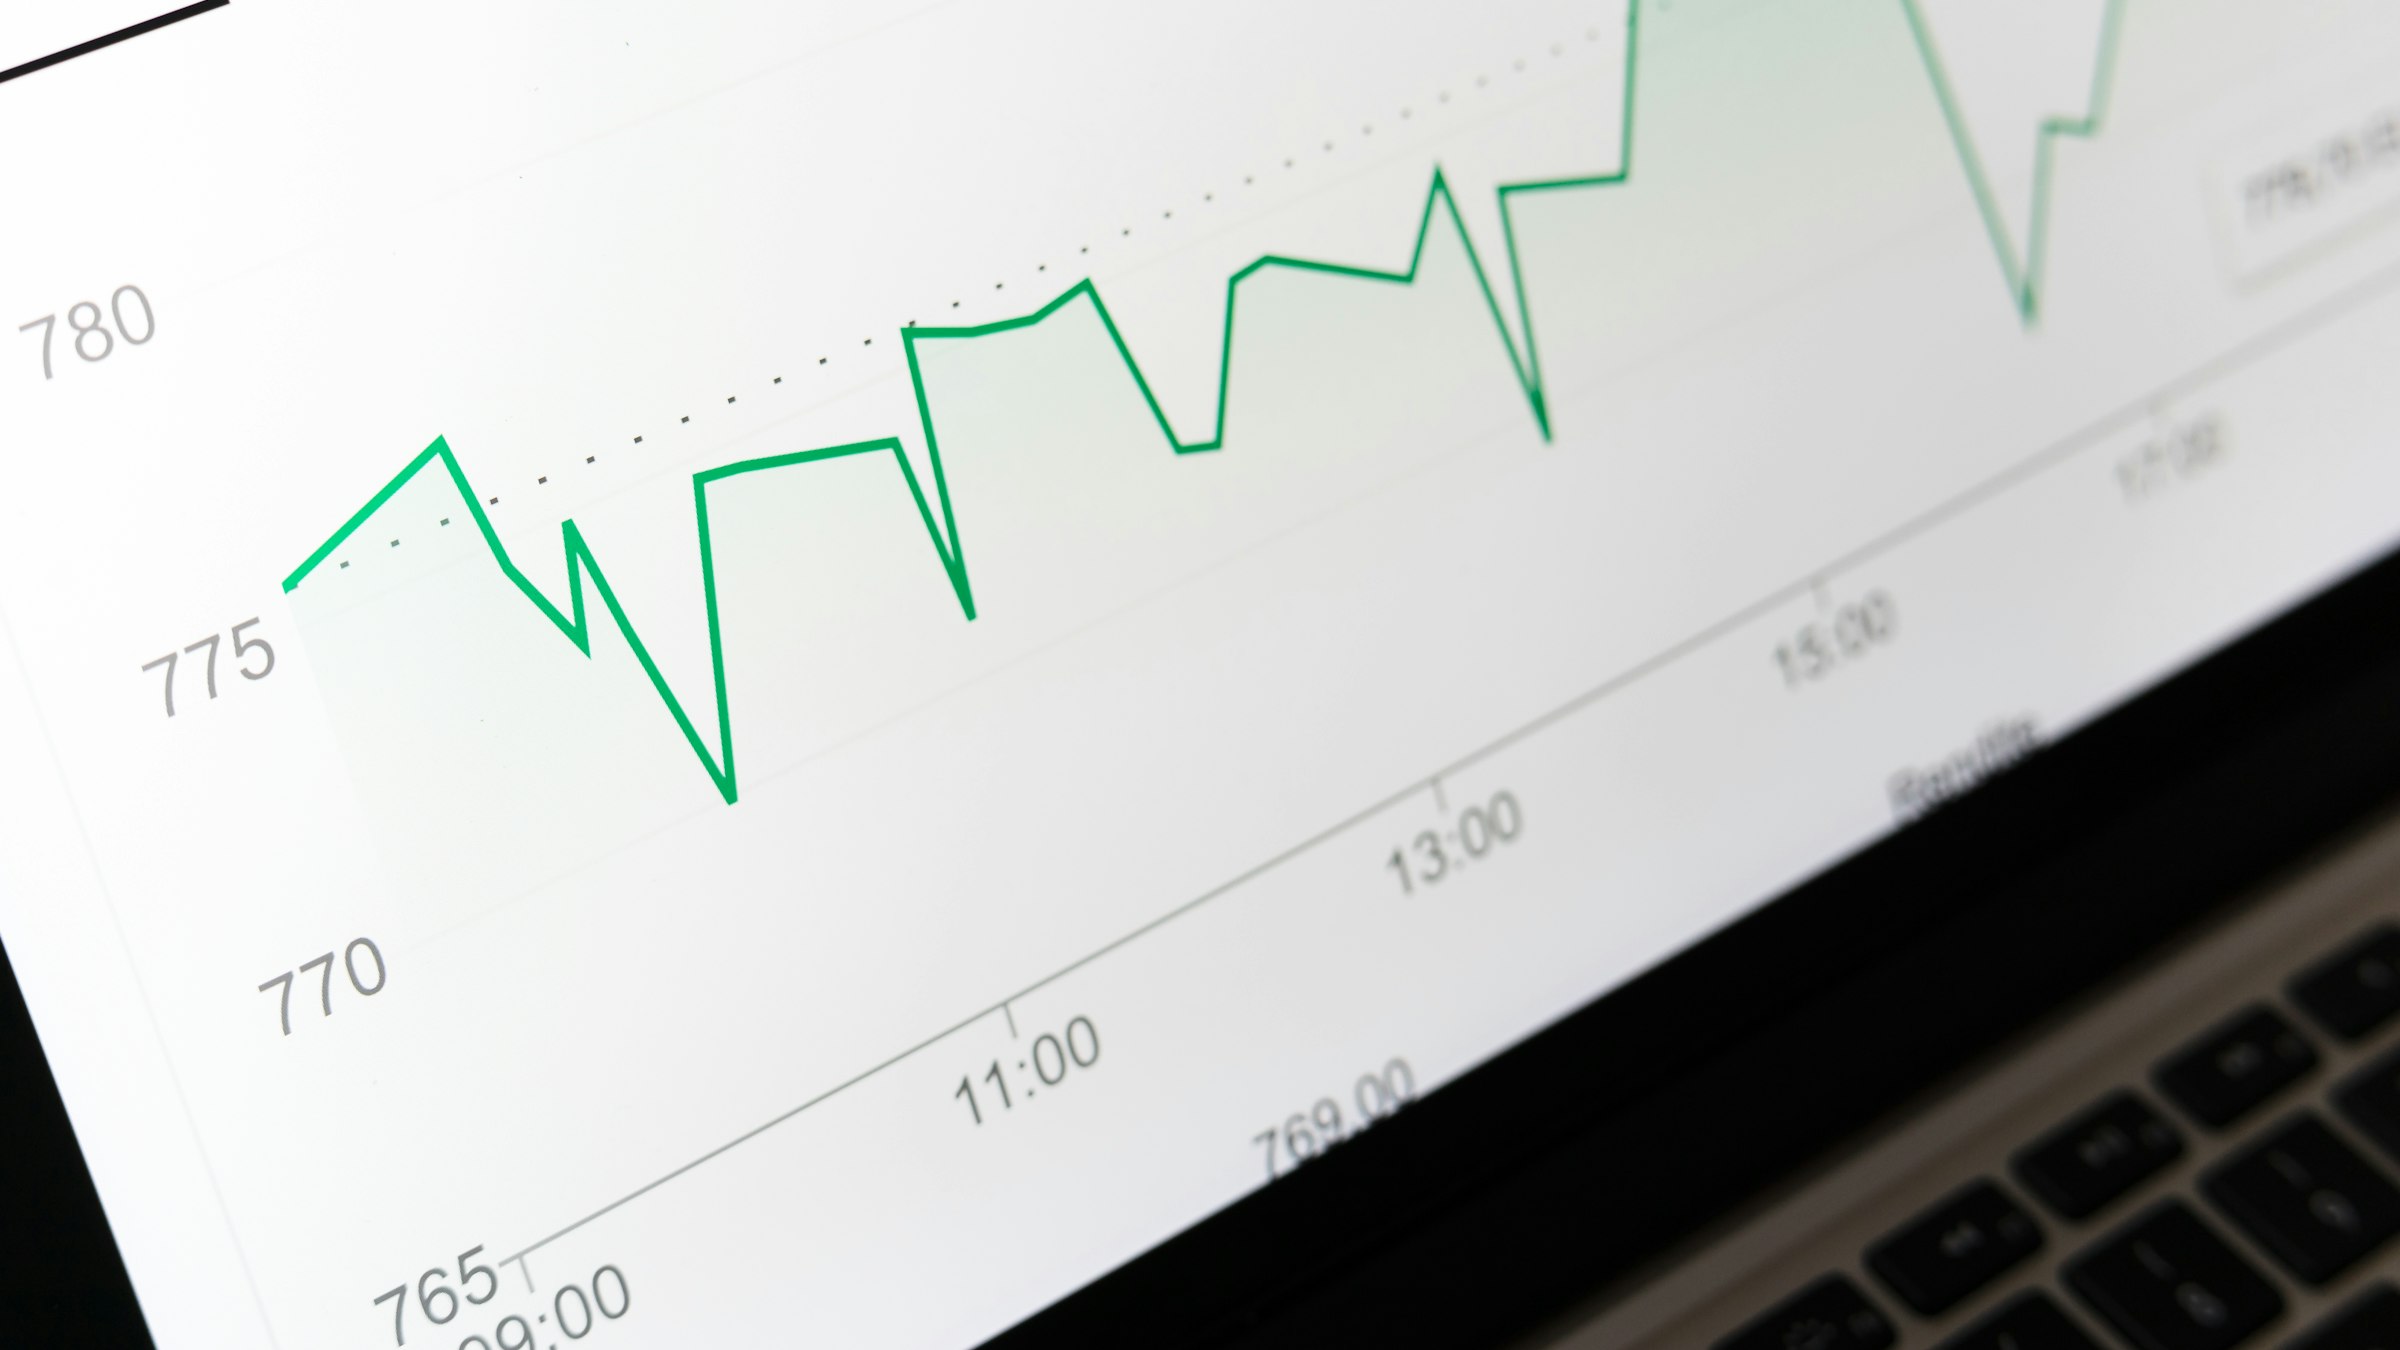
Every trading bot backtest looks like a staircase. The line climbs from the bottom left to the top right, the dips are shallow, and the footnote says “past performance does not guarantee future results” in a font size nobody can read. If you have ever wondered whether that chart means anything, the honest answer is this: a trading bot backtest tells you what a rule would have done on data the author already knew, so by itself it proves almost nothing. What matters is how the test was built, and you can check that in about ten minutes.
This guide shows what to look for. It covers the number of trades, the worst drawdown, the costs, the data and, above all, whether the rule ever met data it had not seen. None of it requires a statistics degree. It requires the habit of asking one more question than the marketing page expects you to ask.
Why Does Every Trading Bot Backtest Look So Good?
Because the person who built it chose it. A developer who tries fifty versions of a rule will publish the one with the prettiest chart, and the other forty-nine will never exist as far as you are concerned. The chart is real in the narrow sense that the arithmetic is correct. It is misleading in the broader sense that it is the winner of a contest you were never shown.
Statisticians call this backtest overfitting, and every trading bot backtest is exposed to it. In “The Probability of Backtest Overfitting”, published in the Journal of Computational Finance, David Bailey, Jonathan Borwein, Marcos López de Prado and Qiji Zhu propose a framework for estimating how likely it is that a strategy picked for its historical performance is simply a fit to noise. The very existence of that research tells you something: the people who study this for a living treat a flattering backtest as a hypothesis to be attacked, not a result to be admired.
Campbell Harvey and Yan Liu made a related point in their paper “Backtesting” in the Journal of Portfolio Management, 2015. The industry habit of cutting a reported Sharpe ratio in half to allow for data mining is, in their words, only a rule of thumb. Their analysis shows the correction is nonlinear: strategies with modest numbers lose far more than half, while truly strong ones lose less. The takeaway for a reader is practical. The more variations a team tried, the less the best one is worth, and the team rarely tells you how many it tried.
A good chart is where the investigation starts, not where it ends.
How Do You Read a Trading Bot Backtest Without Being Fooled?
Start with the order of questions, because the order saves time. First ask whether the test included data the rule was never tuned on. If the answer is no or “we do not say,” you can stop, since every other number inherits that weakness. Then ask how many trades produced the result, how deep the worst losing stretch was, what costs were charged, and which assets and dates were included. Each question closes one door through which a misleading result usually enters.
Think of a trading bot backtest as a restaurant review. A five-star rating from one visit by the owner’s cousin is not worthless, but you would want to know who ate there, how many times, and whether anyone else agreed. A backtest has the same weak points: a small sample, an interested author and a selected moment. The difference is that a restaurant rating comes with a number of reviews, while a backtest rarely comes with a count of attempts.
It also helps to separate what a trading bot backtest can and cannot tell you. It can tell you that a rule is not obviously broken, that its behavior in bad stretches is survivable, and that the mechanics make sense. It cannot tell you that the future will resemble the sample. That distinction matters for every product, ours included, and it is why we explain methodology rather than quote a return figure. For the wider picture of what automated systems can and cannot promise, our honest answer on whether crypto trading bots work goes through it in detail.
Read the method first and the picture last.
Was the Rule Ever Tested on Data It Had Not Seen?
This is the single most important line in any set of backtest results, and most pages leave it out. A rule can always be made to fit the past; the past is fixed, and with enough knobs to turn, a model can be bent to trace it almost perfectly. The only evidence that the fit is more than memorization is a test on a stretch of data that played no part in building the rule.
Done properly, the history is split. One part is the workshop where ideas are tried and discarded freely. The other part is held back, untouched, and used once at the end. The word “once” carries the weight here. If a team looks at the held-back period, dislikes the answer, adjusts the rule and looks again, the held-back period has quietly become part of the workshop, and the test no longer means what it claims. We wrote about this discipline at length in our piece on out-of-sample validation and why most backtested strategies fail live.
So the question to put to any provider is specific: was there a separate period, was it examined only once, and what happened to rules that failed it? A credible answer sounds boring and procedural. An evasive answer talks about “proprietary optimization” or “years of experience” and never mentions a held-back period at all.
A trading bot backtest without an unseen period is a memory, not a test.
How Many Trades Is Enough to Trust Backtest Results?
More than the page usually shows. A strategy that made twelve trades over three years and gained on nine of them has a win rate that looks impressive and a statistical meaning close to zero. Twelve outcomes cannot separate skill from luck, because a small run of fortunate entries would produce the same chart. The honest reading of a tiny sample is “we do not know yet.”
There is no magic threshold, and anyone who gives you one is simplifying. What you want is a trade count large enough that no single trade or single week explains the outcome. Ask what share of the total gain came from the best few trades. For a trend-following system that share is naturally high, because the method is designed to lose small many times and win big occasionally. That is not a flaw, but it means you should expect long flat or negative stretches in the record, and be suspicious if there are none.
The reverse trap is just as real. A high-frequency trading bot backtest with thousands of tiny trades looks statistically solid, yet it can be the most fragile of all, because tiny edges are exactly the ones that costs destroy. Trade count answers one question, whether the sample is large, and leaves the others open. Look at it next to fees and slippage, not instead of them.
A small sample can only whisper, and whispers are easy to mishear.
What Does the Equity Curve Hide About Drawdowns?
The smooth upward line in a trading bot backtest hides the experience of living through it. The number that captures that experience is maximum drawdown: the largest fall from a peak to a later low during the test. It answers a human question, namely how bad did it get before it got better, and it is usually more honest than any average return.
Check three things about it. First, whether it is reported at all; a page that shows gains and says nothing about the deepest fall is telling you which half of the story it prefers. Second, how long the recovery took, because a drawdown that lasted fourteen months tests your patience differently from one that lasted fourteen days. Third, whether the curve was measured on closed trades only or on marked-to-market positions. A system can hold a deeply losing position for weeks, and a chart built only from closed trades will not show the pain until the position is shut.
With leveraged crypto futures there is a further point. A trading bot backtest whose drawdown never approached a liquidation level on paper may still be dangerous in practice, since exchanges liquidate positions on margin rules, not on how a spreadsheet sees the equity line. Any bot trading perpetual futures carries the real possibility of large losses, up to the loss of the whole account balance, and a record that does not take margin into account is incomplete. We cover how a systematic approach thinks about this in our article on managing crypto risk without stop-loss orders.
Gains are the brochure; the drawdown is the road test.
Does the Trading Bot Backtest Include Fees, Slippage and Funding Costs?
It should, and a surprising number do not. Every trade on a futures exchange pays a fee, every market order moves the price a little against you, and perpetual contracts charge or pay funding at regular intervals depending on which side you hold. A test that ignores these costs is measuring a world where trading is free, and that world does not exist on KuCoin, Bybit or anywhere else.
The sensitivity differs by style. A system that trades rarely and holds for weeks barely notices a small change in assumed fees. A system that trades constantly can see its entire edge vanish when realistic costs replace optimistic ones. So the useful question is not just “were costs included” but “what happens to the result if costs are doubled?” A robust rule survives that stress. A fragile one turns negative, which tells you its profit was living inside the rounding error of the assumptions.
Execution timing matters in the same way. If a test assumes you could buy at the exact closing price of a bar that you only knew was the close after it finished, it has quietly given the bot a glimpse of the future. This is called look-ahead bias, and it makes results look better than anything achievable live. Ask how the order was assumed to be filled, and at what price relative to the signal.
Profit that depends on free trading is not profit, it is an assumption.
What Is Survivorship Bias, and Why Does It Flatter Crypto Backtests?
Survivorship bias means a trading bot backtest only includes assets that still exist today. Crypto is unusually exposed to it because the list of tradable coins turns over fast. Hundreds of tokens that traded actively in earlier years have since been delisted or have collapsed to nothing, and a backtest built from today’s top coins quietly skips every one of them. The coins that made it into the sample did so partly because they survived, which is exactly the information a trader in the past did not have.
The effect pushes in one direction only. It makes a long-only buy-the-winners approach look wiser than it was, and it hides the cases where a rule would have held a dying asset all the way down. When you read a trading bot backtest, look for how the universe of assets was chosen. The better answer is that the list was fixed by a rule at each point in time, using only what was knowable then. The weaker answer is “the top coins by market cap,” without saying when that ranking was taken.
The same logic applies to date ranges. A test that starts right at a market bottom and ends at a peak will flatter nearly any long-biased rule. Ask whether the sample covers a full range of conditions, including long sideways periods and sharp reversals, and not only the stretch that happened to suit the method. A trend-following approach, for instance, behaves very differently in a persistent trend than in a choppy range, which is the heart of the difference we describe in grid bots versus trend-following bots.
What the sample leaves out is often the whole lesson.
What Should You Ask a Provider Before You Trust Their Numbers?
Ask the same short set of questions every time and compare the quality of the answers, not the size of the numbers. Was there an unseen period, and was it used once? How many versions of the rule were tried before this one? What do the costs assumptions look like? What was the worst drawdown and how long did recovery take? How were the assets chosen? A provider who answers these plainly has probably thought about them. A provider who answers with a screenshot and a testimonial has not.
Pay attention to what is missing as much as what is present. Real trust signals tend to be unglamorous: a stated method, an admission of limits, a record of losing periods, and a clear description of what the software can and cannot do with your account. Warning signs tend to be glamorous: a guaranteed monthly figure, a countdown timer, a ranking of “top bots” in which every entry links to a sign-up page. Our guide to spotting a crypto trading bot scam collects those patterns.
The word “AI” deserves the same scrutiny. A model that learns from price history is more, not less, prone to fitting noise, which makes a clear validation method more important rather than less. We discuss that tension in what AI actually means in an AI crypto trading bot.
It is also fair to apply this standard to us. Our product is a rule-based trend-following system, and the way we judge any change to it is the way described above: build on one period, test once on a separate later period, and adopt the change only if it holds. You can read how the pieces fit together on the how it works page. We do not publish a return figure in articles, because a number without its full method attached invites exactly the misreading this article warns about, and because trading leveraged futures can lose money, including the full balance of an account.
Trust the provider who shows you the seams.
So What Does a Good Trading Bot Backtest Actually Look Like?
It looks a little disappointing. It has an ugly drawdown that is stated openly, long stretches where nothing much happens, and a gain that comes from many modest wins and a few larger ones rather than a perfect run. It shows an unseen test period with results that are worse than the training period, because that is what honest out-of-sample results usually look like. A dip from the development period to the validation period is normal. A validation result that is somehow better than the development result should make you more careful, not more excited.
It also comes with limits attached. Good documentation says which markets were covered, how costs were charged, what was excluded, and what the test cannot say about the future. It explains that markets change, that a rule that worked in one regime may struggle in another, and that the purpose of a systematic approach is to behave consistently, not to win every month.
Finally, even a good trading bot backtest is only one input. Treat it as the entrance exam and treat live behavior as the real course. Watch how a provider handles bad periods once real accounts are involved, whether the stated rules are the rules that run, and whether you keep custody of your funds throughout. A trade-only API connection, where the software can place orders but cannot withdraw, means the worst failure of the software is a bad trade, not a vanished balance. That is a structural fact you can verify on your own exchange account, and it is worth more than any chart.
The best trading bot backtest is the one that makes you slightly less excited and considerably better informed.
How do you read a trading bot backtest?
To read a trading bot backtest, read the method before the chart. Check whether the rule was tested once on data it was never tuned on, how many trades produced the result, how deep the maximum drawdown was, whether fees, slippage and funding were charged, and how the assets and dates were chosen. A backtest missing most of these answers is marketing, not evidence.
Can a backtest predict future trading results?
No. A backtest shows how a fixed rule would have behaved on past data, and the future can differ in ways the sample never contained. It can rule out a broken strategy and reveal how painful the bad stretches were, but it cannot promise returns. Treat any provider who implies otherwise with caution.
What is a fake or misleading backtest?
A misleading trading bot backtest looks precise but hides how it was built. Common tricks include tuning the rule on the same data used to judge it, ignoring trading costs, using only coins that survived to today, starting the test at a market low, and showing only the best of many attempts. The arithmetic can be correct while the conclusion is still false.
What is a good maximum drawdown for a crypto trading bot?
There is no universal good number, because drawdown depends on leverage, strategy style and risk setting. What matters is that it is disclosed, that you could live with it in real money, and that the recovery time is stated. Be wary of any record showing almost no drawdown in crypto futures, as that usually signals missing costs or a very short sample.
What does out-of-sample mean in a backtest?
Out-of-sample means the rule was evaluated on a period of data that played no part in designing or tuning it. The test is meaningful only if that period was examined once and the result accepted whatever it showed. Results that look worse out of sample than in development are normal, and they are a sign of honest testing.
This article is for educational purposes only and is not investment, financial or trading advice. Trading crypto perpetual futures with leverage carries a significant risk of loss, including the total loss of invested funds. Please read our Risk Disclosure before using any trading service.